Most web design decisions get made on gut feeling. “I think this looks good.” “Our competitor does it this way.” “My nephew says we need more animations.”
Here’s what actually happens: users form an opinion about your website in 0.05 seconds. That’s fifty milliseconds. You blink slower than that. And 94% of that snap judgment is based on design, not content.
So yeah, web design matters. But which parts matter most? We pulled together 47 statistics from industry research published in 2024 and 2025 to give you the full picture. Every stat is linked to its original source. Bookmark this page, share it with your team, argue about it in your next design meeting.
First Impressions and Credibility
The relationship between web design and trust isn’t abstract. It’s measurable.
1. 94% of first impressions are design-related, formed in about 0.05 seconds. Users aren’t reading your mission statement during that window. They’re processing layout, color, spacing, and visual hierarchy.
2. 75% of people judge a company’s credibility based on its website design. Not on its Google reviews. Not on its social media following. The website itself.
3. 38% of people will stop engaging with a website if the content or layout is unattractive. That’s more than a third of your traffic walking out the door before they ever learn what you do.
4. 57% of internet users say they won’t recommend a business with a poorly designed mobile website. Bad design doesn’t just lose you the person visiting. It loses you everyone they might have told.
5. 90% of users will leave a poorly designed website entirely. That’s not a bounce rate problem, it’s a business problem.
6. When consumers were asked which visual elements they valued most, 40% said photos, 39% said color scheme, and 21% said video. Photography and color palette aren’t afterthoughts. They’re your first line of communication.
Page Speed: Where Money Goes to Die
If there’s one area where the data is unambiguous, it’s speed. Slow sites lose money. Period.
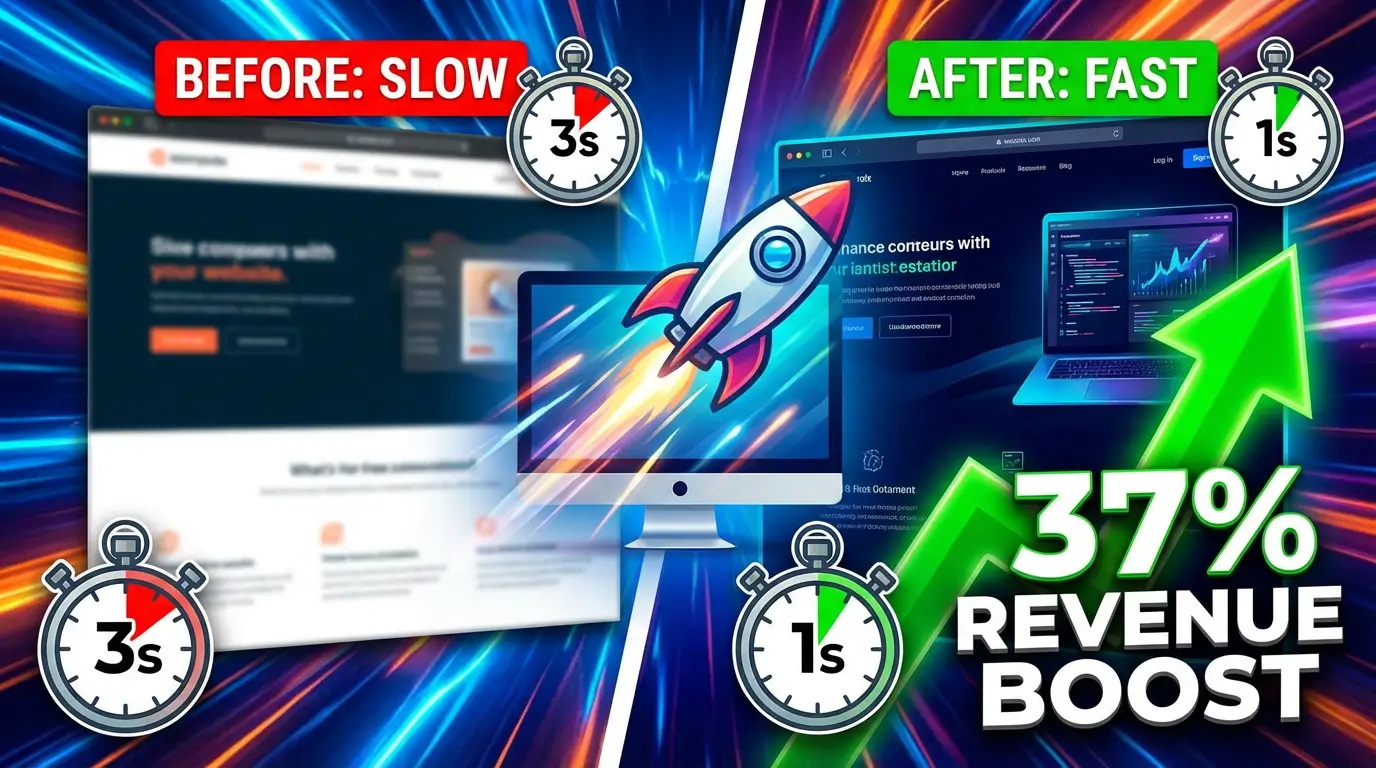
7. 53% of mobile users will abandon a page that takes longer than 3 seconds to load. Over half your visitors, gone, because of a few seconds.
8. A one-second delay in page load time causes a 7% drop in conversions. If your site does $100,000 in annual revenue, that’s $7,000 evaporating into thin air.
9. Deloitte found that a 0.1-second improvement in site speed increased conversion rates by 8% for retail sites and increased customer spending by 10%. A tenth of a second. That’s the margin.
10. E-commerce sites with load times between 1 and 2 seconds achieve the highest conversion rates, averaging 3.05% at 1 second. Every second beyond that costs you.
11. Website conversion rates drop by 2.11% with each additional second of loading time between 0 and 9 seconds. The decline is steady and predictable.
12. For every 10 seconds of load time, bounce rates increase by 123%, according to Google’s own research.
13. The top 10 results on Google SERPs have an average page speed of 1.65 seconds. If you want to rank, your site needs to be fast. Not “pretty fast.” Actually fast.
14. Only 47% of websites currently meet Google’s Core Web Vitals thresholds. More than half the web is failing Google’s own performance standards.
Mobile: Where Your Customers Actually Are
The desktop-first era ended years ago. If you’re still designing for widescreen monitors first and “making it responsive later,” you’re building for an audience that keeps shrinking.
15. Mobile devices now account for 58-60% of all web traffic globally, and smartphones drive 78% of retail website traffic specifically.
16. 63% of global web traffic comes from mobile devices. That number has grown every single year for the past decade.
17. Mobile users are 67% more likely to purchase from a mobile-friendly site. The gap between mobile-optimized and mobile-tolerable is real revenue.
18. 81% of websites still perform poorly on mobile UX, according to the Baymard Institute. The bar is low, which means there’s a real opportunity for businesses that clear it.
19. When mobile pages take over 4 seconds to load, 63% of users leave. At 6 seconds, about 66% are gone. There’s almost no difference between 4 and 6 seconds because by then you’ve already lost most people.
20. Mobile cart abandonment rates hit 85.65%, compared to the overall average of 69.99%. Mobile checkout is where e-commerce goes to suffer.
21. 84% of users report difficulty completing transactions on mobile. That’s not a user problem. That’s a design problem.
22. 49% of users primarily browse with one thumb. If your key actions aren’t in the thumb zone, you’re making people work harder than they should.
23. 15% of U.S. adults are smartphone-only internet users with no home broadband. For the 18-24 age group, that jumps to 20%. For these users, your mobile site is your only site.
User Experience and Behavior
Design isn’t just aesthetics. It’s how people move through your site, what they find, and whether they stick around.
24. 88% of users won’t return to a website after a bad experience. You get one shot. Maybe.
25. 61% of users will leave a site if they can’t find what they’re looking for within 5 seconds. People aren’t patient. They’re not going to “figure it out.” They’re going to leave.
26. Average scroll depth dropped to about 55% of the page in 2025. If your call to action is in the bottom 45% of your page, most visitors will never see it.
27. Cluttered designs see bounce rates about 50% higher than clean, minimal layouts. Minimal, content-first layouts increase viewing time by roughly 59%.
28. Better navigation can reduce bounce rates by 10-15% and increase task success by up to 40%. The menu matters more than most people think.
29. Navigation issues cause 30-40% of mobile usability problems. Users typically leave if they can’t find what they need within 10-15 seconds.
30. 86% of visitors landing on a company’s homepage say they want to see information about products and services right away. Not your founder’s story. Not your “why.” Your products and services.
31. On sites with UX issues, visitors trigger an average of 53 rage-clicks per session. If you’ve ever clicked a button over and over because it didn’t respond, you know the feeling.
Conversion Rates and CTAs
All the traffic in the world doesn’t matter if it doesn’t convert. Here’s what the numbers say about turning visitors into customers.
32. The average conversion rate across industries is about 2.9%. If you’re above 3%, you’re beating most of the market. If you’re below 2%, something is broken.
33. Well-executed UI design can increase conversion rates by up to 200%. Good UX can boost it by more than 400%. These aren’t incremental improvements. They’re transformative ones.
34. CTAs placed above the fold perform 304% better than those buried below it. And centered CTAs get up to 682% more clicks than left- or right-aligned buttons.
35. 70% of small business websites don’t include a call to action on their homepage. Seven out of ten. They’re building storefronts with no cash register.
36. Cutting a form from 9 fields to 5 fields drove a 34% increase in conversions in one case study. Every field you add is friction. Friction kills conversions.
37. Websites that use video have an average conversion rate of 4.8% vs 2.9% for sites without video. That’s a 66% improvement from adding a single content type.
38. Security and payment trust badges near checkout can increase conversions by 12-27%. Trust signals work because online trust is still fragile.
Accessibility: The Gap That Won’t Close Itself
Web accessibility isn’t just a nice-to-have. It’s a legal requirement in many jurisdictions, and the enforcement landscape is getting more serious.
39. 96%+ of websites still fail basic WCAG accessibility checks. That’s not a rounding error. Almost the entire web is non-compliant.
40. 94.8% of the top 1 million homepages contain detectable accessibility errors. The biggest sites in the world aren’t getting this right either.
41. 2,014 accessibility lawsuits were filed in just the first half of 2025, a 37% increase year-over-year. And 22.6% of those lawsuits targeted sites that already used accessibility widgets, which shows that overlays aren’t a legal shield.
42. 73% of disabled users face accessibility barriers on more than a quarter of the websites they visit. That’s a significant portion of the population being excluded from normal web activities.
43. 79% of screen reader users primarily browse on mobile devices. Mobile accessibility isn’t a niche concern. It’s a primary use case.
AI and the Future of Web Design
AI is changing how websites get built and how users interact with them. The data is early but telling.
44. 93% of web designers now use AI tools in their workflows, including layout generation, image production, and code assistance. The adoption curve was steep and it’s already plateauing near saturation.
45. AI-driven traffic converts at 14.2%, compared to 2.8% from traditional Google search. Users arriving via AI search tend to have clearer intent and land closer to conversion pages.
46. AI-based personalization improves conversions by 20-30% when implemented well. Showing users what they actually want, instead of a generic homepage, works.
47. 91% of consumers say they prefer brands that offer relevant, personalized experiences. The expectation is already there. The question is whether your website meets it.
The Industry by the Numbers
A few broader statistics to put everything in context:
The global web developer services market is expected to reach $135.9 billion by 2032, growing at 8.7% CAGR. The U.S. web design services market alone is worth $40.8 billion. Small businesses with websites grow roughly 2x faster than those without. The average cost to have a professional agency build a small business website is $2,000-$9,000, while a DIY builder can get you started for as little as $16/month.
And here’s one that should stick with you: investing in UX design can return an ROI of 9,900%. That’s not a typo. For every dollar spent on UX, the average return is $100.
What This Means for Your Business
These 47 statistics tell a consistent story. Design affects trust. Speed affects revenue. Mobile isn’t optional. Accessibility is both a moral and legal obligation. And AI is reshaping user expectations faster than most businesses can adapt.
If you’re planning a new website or thinking about a redesign, don’t start with what looks cool. Start with what the data says works: fast load times, clean layouts, clear calls to action above the fold, mobile-first design, and real accessibility compliance (not overlay widgets).
The businesses that treat their website as a performance tool instead of a digital brochure are the ones that win. The numbers prove it.
Ready to build a website that actually performs? Get in touch with our team and let’s talk about what the data says your business needs.

Richard Kastl
Founder & Lead EngineerRichard Kastl has spent 14 years engineering websites that generate revenue. He combines expertise in web development, SEO, digital marketing, and conversion optimization to build sites that make the phone ring. His work has helped generate over $30M in pipeline for clients ranging from industrial manufacturers to SaaS companies.