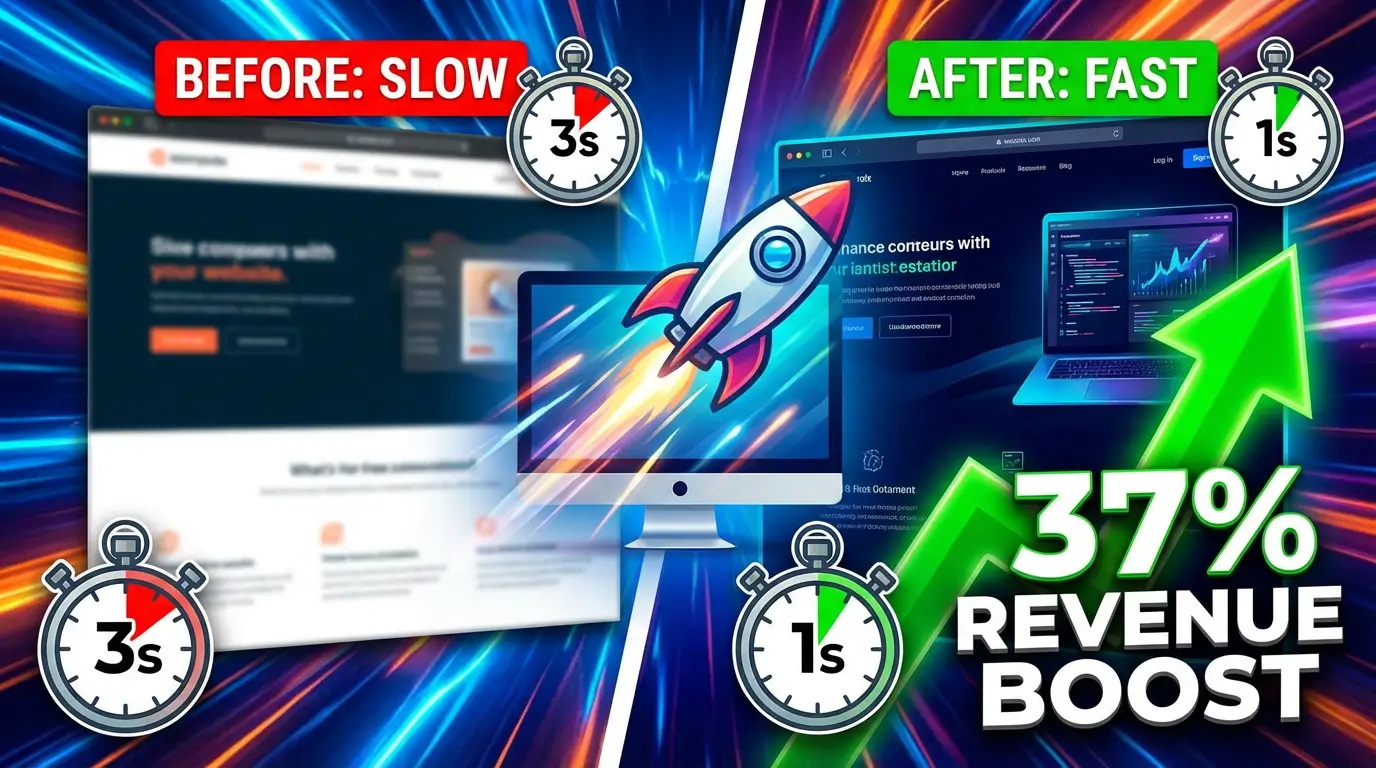
How a 2-Second Faster Website Increased This Business's Revenue by 37%
In 2020, Deloitte partnered with Google and data company Fifty-five to answer a simple question: does website speed actually affect revenue? They studied 30 million user sessions across 37 brand websites in Europe and the United States. The results were unambiguous.
A 0.1-second improvement in mobile site speed increased conversion rates by 8.4% for retail sites and 10.1% for travel sites. Average order values increased by 9.2% for retail. Page views per session went up. Bounce rates went down. Across every metric they measured, faster sites made more money.
That study is now six years old. The relationship between speed and revenue has only gotten stronger as mobile traffic has grown and user patience has shrunk.
The Math That Changes How You Think About Your Website
Let’s make this concrete with real numbers.
Say your website gets 10,000 visitors per month and converts at 2%. That’s 200 leads or sales per month. Portent’s 2024 analysis of e-commerce sites found that a site loading in 1 second has a conversion rate 5x higher than a site loading in 10 seconds. The conversion rate drops sharply with every additional second.
If your site currently loads in 5 seconds and you bring it down to 2 seconds, you’re not making a marginal improvement. HubSpot’s research shows that B2B sites loading in 1 second convert at 3x the rate of those loading in 5 seconds. Even getting from 5 seconds to 3 seconds can meaningfully change your numbers.
Going from 200 conversions per month to 270 conversions doesn’t sound revolutionary until you multiply it across 12 months and attach a dollar value to each conversion. For a business where each lead is worth $500, that’s an additional $420,000 per year. From making your website 2 seconds faster.
What’s Actually Making Your Site Slow
Website speed problems fall into a few categories, and most businesses are dealing with all of them simultaneously.
Server response time. When someone visits your website, the first thing that happens is their browser asks your server for the page. If your server takes 2 seconds to respond (common with shared hosting running PHP/WordPress), the visitor is already waiting before any content appears. Modern static hosting responds in 50 to 100 milliseconds.
Render-blocking resources. Your browser downloads the HTML, then discovers it needs to download CSS files, JavaScript files, fonts, and analytics scripts before it can show anything on screen. A typical WordPress site loads 15 to 30 external resources. Each one blocks rendering until it’s fully downloaded and processed.
Unoptimized images. A single uncompressed hero image can be 3 to 5 MB. On a mobile connection, that takes 4 to 8 seconds to download by itself. Proper image optimization (correct format, sizing, lazy loading) can reduce page weight by 60 to 80%.
Third-party scripts. Chat widgets, analytics tools, social media embeds, advertising pixels. Each one adds JavaScript that your visitor’s browser has to download and execute. We’ve audited sites where third-party scripts added 4 or more seconds to load time.
Core Web Vitals: Google’s Speed Scorecard
In 2021, Google started using Core Web Vitals as a ranking factor. Three metrics determine how Google scores your site’s user experience.
Largest Contentful Paint (LCP) measures how long it takes for the main content of your page to appear. Google wants this under 2.5 seconds. Most small business sites score between 4 and 8 seconds on mobile.
Interaction to Next Paint (INP) measures how quickly your site responds when someone taps a button or clicks a link. Google wants this under 200 milliseconds. Sites loaded with JavaScript frameworks and plugins often score 500ms or more.
Cumulative Layout Shift (CLS) measures visual stability. When elements on your page jump around as it loads (text shifting, buttons moving, images popping in), that’s layout shift. Google wants a CLS score under 0.1. Ads, lazy-loaded images without dimensions, and dynamically injected content are the usual culprits.
Sites that fail Core Web Vitals don’t just deliver a bad experience. They rank lower in Google search results. You’re being penalized for being slow.
What Fast Actually Looks Like
A modern website built with Astro typically scores 95 to 100 on Google’s PageSpeed Insights for both mobile and desktop. Here’s why.
Astro pre-builds every page into static HTML at deployment time. When a visitor requests a page, the server returns a pre-built file in milliseconds. No database queries, no server-side rendering, no PHP execution. The page is already built and waiting.
Astro ships zero JavaScript to the browser by default. If a page doesn’t need interactivity, no JavaScript is loaded. For pages that do need interactive elements (a form, a calculator, an accordion), Astro loads only the JavaScript for that specific component and only when it becomes visible on screen. This approach, called “islands architecture,” means your pages load fast even when they include complex functionality.
Compare this to a typical WordPress page that loads jQuery, the theme’s JavaScript, Elementor’s scripts, three plugin scripts, Google Analytics, and a chat widget. That’s 200 to 500KB of JavaScript on every single page load, whether the visitor needs it or not.
The Speed Advantage Compounds Over Time
Faster sites don’t just convert better in the moment. They accumulate advantages over time.
Google crawls faster sites more frequently, which means new content gets indexed sooner. Better Core Web Vitals improve your search rankings, which drives more traffic. More traffic with higher conversion rates means more revenue. More revenue means more budget for content and marketing. It becomes a flywheel.
Cloudflare’s analysis puts the revenue impact at approximately 4% per 2-second delay. That might sound small, but compound it across thousands of visitors over 12 months and you’re looking at a significant chunk of revenue that simply evaporates because your site is too slow.
What a Speed Transformation Looks Like
We recently rebuilt a professional services firm’s website from WordPress to Astro. Their WordPress site loaded in 6.3 seconds on mobile with a PageSpeed score of 34. After the rebuild, the same pages loaded in 0.9 seconds with a PageSpeed score of 98.
Within 60 days, their organic traffic increased by 23% as Google re-evaluated their Core Web Vitals. Their contact form submissions increased by 41%. Their bounce rate dropped from 62% to 31%.
They didn’t change their content, their pricing, or their marketing budget. They changed how fast their website delivered that content to visitors.
Stop Bleeding Revenue to a Slow Website
Every day your website takes 5 seconds to load, you’re losing customers to competitors whose sites load in 1 second. The data is clear. The solution exists. The only question is how long you’re willing to wait.
If you want to see exactly how much speed is costing your business, schedule a free site audit with our team. We’ll test your site’s real-world performance, calculate the revenue impact, and show you what a modern rebuild would look like. No pressure, just data.

Richard Kastl
Founder & Lead EngineerRichard Kastl has spent 14 years engineering websites that generate revenue. He combines expertise in web development, SEO, digital marketing, and conversion optimization to build sites that make the phone ring. His work has helped generate over $30M in pipeline for clients ranging from industrial manufacturers to SaaS companies.