A high bounce rate can mean your page is failing.
It can also mean your page did exactly what the visitor needed.
That is why bounce rate is one of the most misused metrics in web design, SEO, and CRO. Too many teams see one ugly percentage in GA4, panic, and start changing headlines, layouts, or calls to action without asking the real question first.
Compared to what?
If you run a small business website, manage marketing, or build sites for clients, this guide gives you a cleaner benchmark. Below, I pulled together the most useful bounce-rate data I could find from Google, Databox, Contentsquare, Unbounce, and Nielsen Norman Group, then translated it into something practical.
First, what bounce rate means in GA4
Before you benchmark anything, you need the right definition.
According to Google Analytics Help, GA4 bounce rate is the percentage of sessions that were not engaged sessions. Google says an engaged session is one that lasts longer than 10 seconds, has at least 1 key event, or has at least 2 page or screen views.
That matters because a bounce in GA4 is not exactly the old Universal Analytics version people still quote from memory. A visitor can land on one page, stay for a while, convert, or trigger meaningful engagement, and not count as a bounce.
So if you are still treating bounce rate like a simple “one page and gone” score, you are already starting from the wrong baseline.
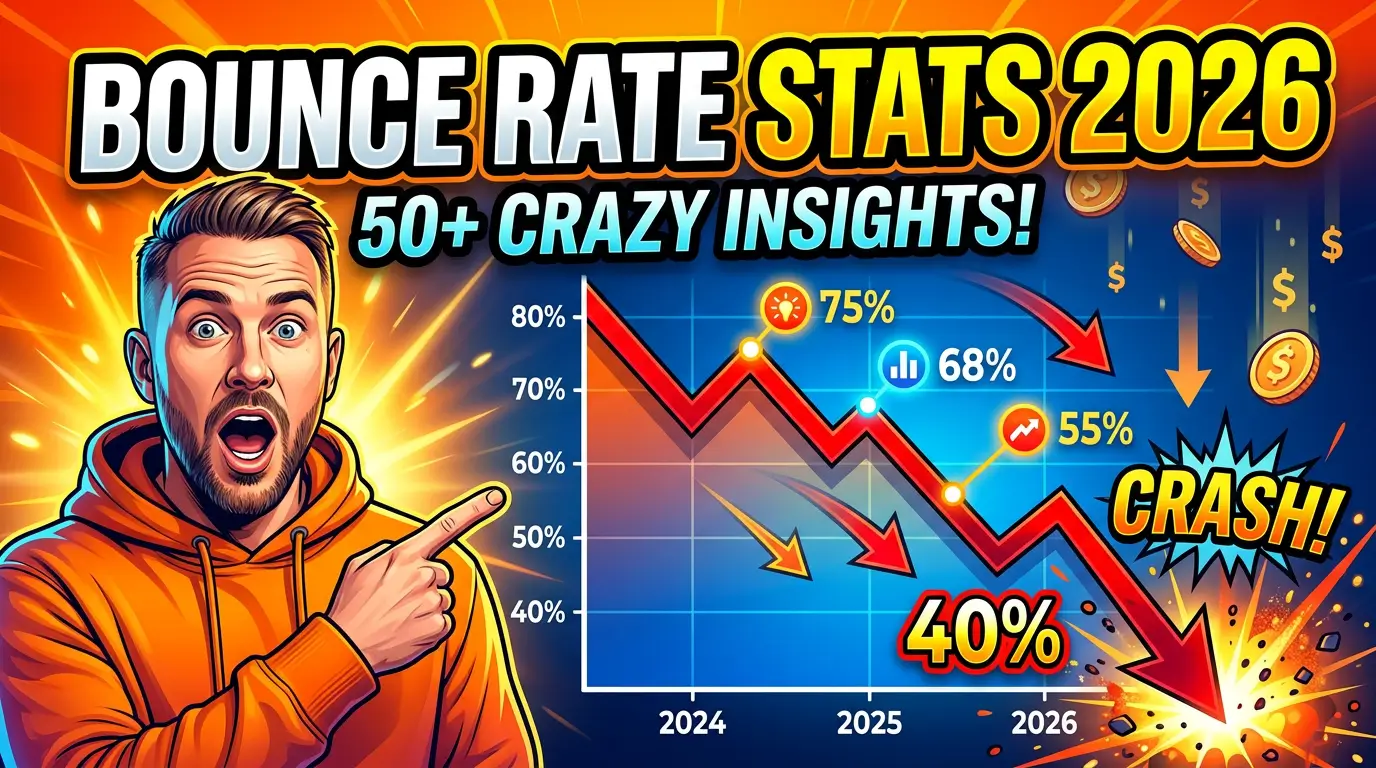
The most useful bounce rate benchmarks for 2026
Here are the numbers worth keeping handy.
- Databox reports the median bounce rate across all industries was 44.04% in September 2024. (Databox)
- Contentsquare says the average bounce rate for most websites falls between 40% and 60%. (Contentsquare)
- Databox puts Industrials & Manufacturing at a 41.78% median bounce rate. (Databox)
- Apparel & Footwear came in lower at 35.76%. (Databox)
- Technology posted a 48.28% median bounce rate, and SaaS was almost identical at 48.27%. (Databox)
- Consulting & Professional Services reached 47.84%, while Education was 46.28%. (Databox)
- Ecommerce & Marketplaces were lower at 38.61%, and Travel & Leisure was 38.84%. (Databox)
- Think with Google says the probability of a bounce increases 32% when page load time goes from 1 second to 3 seconds. (Think with Google)
- That bounce probability increases 90% when load time goes from 1 second to 5 seconds. (Think with Google)
- Contentsquare’s 2025 benchmark report says 40% of online visits were affected by user frustration. (Contentsquare)
- That same report says slow-loading content caused 53% of users to exit after viewing just a single page. (Contentsquare)
- Paid channels accounted for 39% of all digital traffic in Contentsquare’s 2025 benchmark dataset. (Contentsquare)
- Businesses that leaned harder into paid social saw bounce rates rise 9.2%, along with fewer page views and lower conversions. (Contentsquare)
- Unbounce analyzed 41,000 landing pages, 464 million visitors, and 57 million conversions in Q4 2024. (Unbounce)
- Across that dataset, the median landing page conversion rate was 6.6%. (Unbounce)
- Unbounce says a landing page conversion rate of 10% or higher is generally considered good. (Unbounce)
- Nielsen Norman Group warns that bounce rate can be directly misleading if teams chase a second click instead of user success. (NNGroup)
- NNGroup also notes that some single-page visits are successful visits, especially when users get the answer they needed and leave satisfied. (NNGroup)
Those numbers are the headline. The real value is knowing how to use them.
What is actually a good bounce rate?
For most business websites, a “good” bounce rate is not one magic number.
A reasonable first-pass interpretation looks like this:
- Under 40% usually means strong engagement, assuming the page is getting qualified traffic.
- Around 40% to 60% is normal for many sites and page types. That lines up with both Databox’s 44.04% cross-industry median and Contentsquare’s 40% to 60% general range.
- Above 60% is where you should investigate harder, especially on service pages, location pages, or sales-focused landing pages.
- Above 70% is usually a red flag unless the page is intentionally built for one-and-done behavior, like a simple contact-info page, event page, or blog post answering one narrow question.
That is the practical benchmark I would use with most small business sites.
But you still have to segment by page type, intent, and source.
Industry benchmarks tell you what normal looks like
This is where a lot of business owners get tripped up.
If you compare your local service business homepage to a large ecommerce store, you can easily convince yourself your site is broken when it is not. Databox’s latest industry medians show why broad comparisons are sloppy.
Apparel & Footwear sat at 35.76%, while Ecommerce & Marketplaces landed at 38.61%. That makes sense. Shoppers often browse multiple products, category pages, filters, and carts. The site architecture itself encourages more than one pageview.
Now compare that with Technology at 48.28%, SaaS at 48.27%, and Consulting & Professional Services at 47.84%. Those businesses often attract research-stage traffic. A visitor may read one case study, one service page, or one blog post, then leave to compare vendors. That does not automatically signal failure.
Industrials & Manufacturing at 41.78% is a useful middle ground. It is low enough to show that qualified B2B traffic can engage, but high enough to remind you that many buyers are still in research mode.
If you build websites for clients, this is the easiest way to stop bad reporting conversations before they start. Benchmark the client against their category, not against whatever random bounce-rate myth they saw in a LinkedIn post.
Speed still wrecks bounce rate fast
If you only remember two bounce-rate stats from this article, make them the Google ones.
Think with Google says bounce probability rises 32% when load time moves from 1 second to 3 seconds. Push that to 5 seconds, and the probability of bounce rises 90% according to this Think with Google data point.
That is not a small optimization story. That is a serious conversion story.
Then Contentsquare adds a harsher business lens. In its 2025 digital benchmark report, the company found 40% of visits experienced frustration and 53% of users exited after a single slow-loading page.
If your site is visually polished but still slow, you should not be surprised by a bad bounce rate. A nice design cannot compensate for visitors staring at a loading spinner.
For small businesses, this is usually where the easy wins are hiding:
- oversized hero images
- too many third-party scripts
- bloated WordPress themes or page builders
- video or animation loading before the main offer is visible
- weak hosting on traffic-sensitive pages
You do not need a perfect Lighthouse score. You do need pages that feel fast enough for impatient humans.
Paid traffic often makes bounce rate look worse than it is
Another common mistake is reviewing one site-wide bounce rate without separating traffic source.
Contentsquare found that 39% of all digital traffic in its 2025 benchmark set came from paid channels. It also found that businesses increasing their reliance on paid social saw bounce rates rise 9.2%, along with lower page depth and lower conversions.
That does not mean paid social is bad. It means top-of-funnel traffic behaves differently.
A Facebook or Instagram click is often colder, more interrupt-driven, and less committed than a branded search click. If the ad message and landing page promise are even slightly out of sync, people leave fast.
This is why I would never judge a landing page from bounce rate alone unless I also know:
- the traffic source,
- the offer,
- the stage of buyer intent,
- whether the page generated leads or sales anyway.
A 62% bounce rate from cold paid social could be acceptable if the page still converts profitably. A 62% bounce rate from branded search traffic to your core service page is a different conversation.
Landing pages need a different benchmark than websites
A lot of “good bounce rate” advice gets messy because people mix whole websites with campaign pages.
Unbounce’s Q4 2024 dataset covered 41,000 landing pages, 464 million visitors, and 57 million conversions. Across that sample, the median landing page conversion rate was 6.6%, and Unbounce says 10% or higher is generally strong.
That is useful because it forces the right question. If a landing page has a high bounce rate but still converts well, do not “fix” it just to chase a prettier analytics number.
The page exists to produce action, not pageviews.
That said, if the page has both a high bounce rate and weak conversion rate, then you probably have one of four issues:
- the traffic is poorly matched,
- the offer is weak,
- the page loads too slowly,
- or the call to action is not clear enough.
When a high bounce rate is not a problem
This part gets ignored too often.
Nielsen Norman Group makes a smart point, some single-page visits are successful. If someone lands on a pricing explainer, a phone-number page, a short how-to article, or a directions page, they may leave because they got what they came for.
NNGroup also warns that bounce rate can become directly misleading when teams optimize for the second click instead of actual user success.
That is dead on.
If you force extra clicks with teaser copy, buried answers, accordion overload, or “read more” gimmicks just to reduce bounce rate, you can make the site worse while the dashboard looks better.
A better question is this: did the visitor accomplish something useful?
When a high bounce rate is a real problem
You should worry when bounce rate is high on pages that are supposed to move people deeper into the funnel.
That includes:
- homepage traffic from branded search
- core service pages
- location pages
- quote or consultation pages
- paid search landing pages with commercial intent
- lead magnets that are supposed to start a nurture path
If those pages are bouncing hard, the cause is usually not mysterious. It is usually one of the basics, weak message match, cluttered design, poor mobile UX, slow load times, or a CTA that asks for too much too soon.
A better way to diagnose bounce rate in 10 minutes
If I were auditing a small business site quickly, I would use this simple checklist.
1. Segment by page type
Do not compare blog posts to service pages or campaign landing pages.
2. Segment by traffic source
Separate branded organic, non-branded organic, direct, referral, paid search, and paid social.
3. Check bounce rate next to conversion rate
A page with a 58% bounce rate and a strong lead rate is not your first fire.
4. Check speed before rewriting copy
Google’s 32% and 90% bounce-lift numbers are too big to ignore.
5. Review message match
If the ad, title tag, or social post promises one thing and the page opens with something else, visitors leave.
6. Look at mobile separately
A lot of bounce problems are really mobile readability, spacing, sticky-header, or form-friction problems in disguise.
That is enough to get you to the real issue faster than staring at one site-wide average.
The short version
If you want the simplest possible benchmark for 2026, here it is.
For many business sites, something around 40% to 60% is normal based on Contentsquare and Databox. Around 44% is a credible cross-industry midpoint from Databox’s latest benchmark snapshot. If your bounce rate is meaningfully above that, do not panic, but do segment the data and investigate speed, traffic quality, and page intent.
Most important, do not treat bounce rate like a scoreboard.
Treat it like a clue.
If your business wants help figuring out whether your site’s bounce rate is normal, or whether it is quietly costing you leads, get started here.